Dashboard User Guide
Last updated by Roi Efrati on July 29th, 2026.
Overview
The Edgify Dashboard provides a centralized view for monitoring and managing the status and details of your devices, clusters and sites. It enables access to detailed reports on performance metrics for the retailer. Additionally, it allows users to visually inspect and review image data samples to validate prediction accuracy and manage machine learning models effectively.
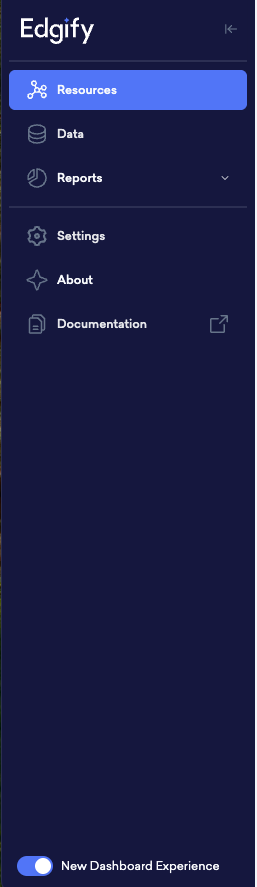
Navigation Panel
- Resources: Provides access to Devices, Clusters, Sites, Alerts and Catalog.
- Data: Section for deeper analysis including image classifications and prediction accuracy.
- Reports: Offers detailed reporting including default and custom reports on various performance metrics.
- Settings: Configuration and administrative options.
- About: Version details and software-related information.
- Documentation: Access to user guides, troubleshooting and support documents.
Tables and Data Export
Most data tables across the dashboard — including Devices, Sites, Clusters, Alerts, and Catalog — include a Download button above the table, alongside the table's filter and search controls.
Clicking Download exports the table's current filtered and sorted view as a CSV file — so applying a filter or search before downloading narrows the export to just those results, rather than exporting everything. Very large exports are capped at 50,000 rows.
This is a separate capability from the PDF export available for Reports — see Reports below for that.
Bulk Actions
Several resource tables across the dashboard — including Devices and Alerts — let you act on multiple rows at once instead of one at a time. Select one or more rows using the checkboxes in the leftmost column; a floating toolbar then appears at the bottom of the screen showing how many items are selected and the bulk actions available for that table (for example, bulk-resolving alerts — see Resources - Alerts below).
If every row on the current page is selected, an additional Select all N from all pages option appears, extending the action to every item matching the table's current filters and search — not just the rows currently loaded on screen.
Site Groups and Sites expose a similar multi-select bulk-actions pattern for applying an Operational Hours schedule to several groups/sites at once — see Resources - Site Groups below.
Resources - Devices
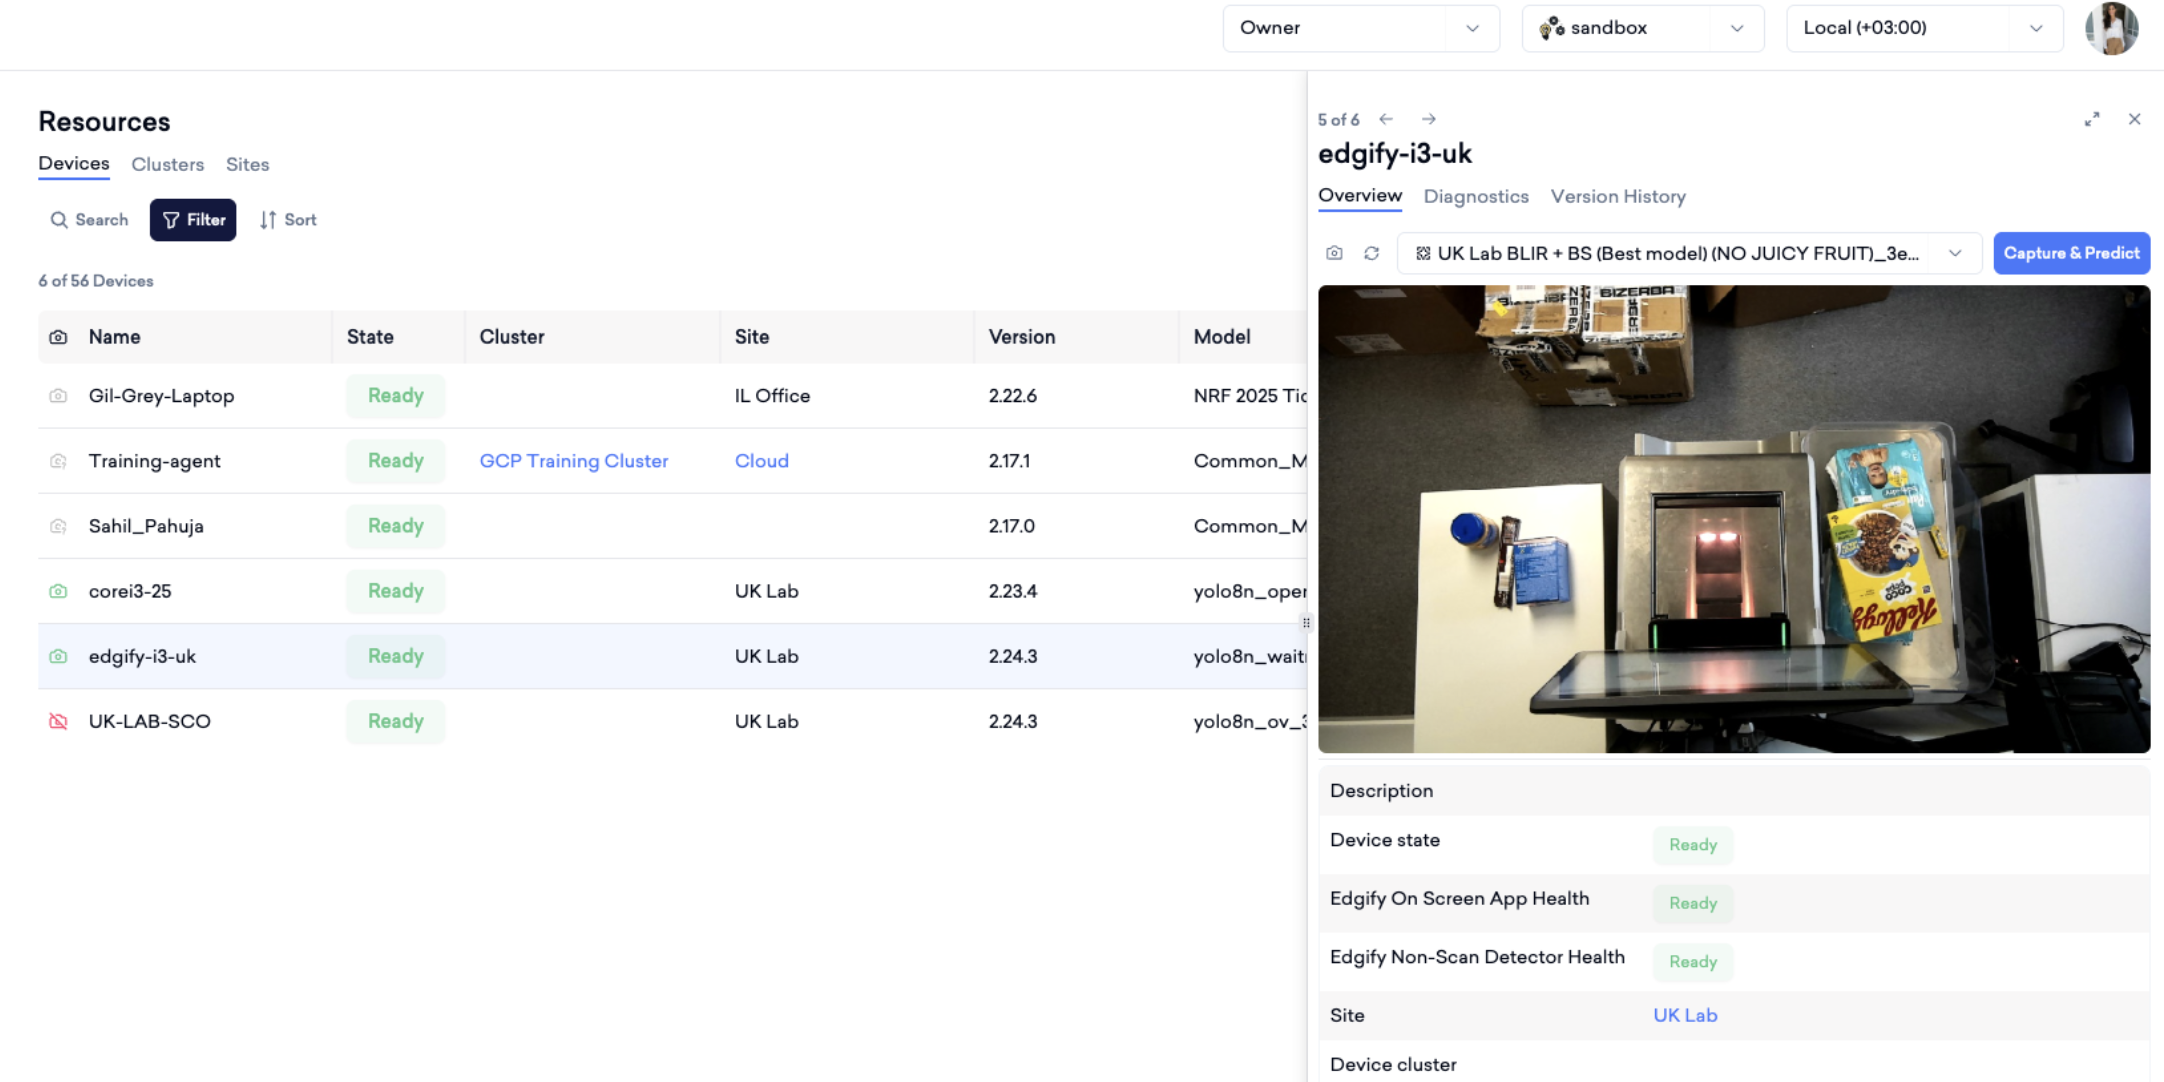
Download: Click the Download button above the table to export the current filtered list of devices as a CSV file — see Tables and Data Export above for details.
Devices - Overview
Clicking a device name opens a detail panel on the right, including:
- Image or camera feed preview (if available)
- Description
- State, Cluster, Site, Agent Version, Activation Time and more data
- Quick Actions:
- Capture Snapshot (for camera-integrated devices)
- Run Diagnostics
- View Version History
Devices - Diagnostics
Navigating to 'Diagnostics' allows users to run diagnostics and verify the device's operational status across different modules.
Diagnostics Modules The following diagnostic modules are available:
- Classifier: Checks the performance of the classification model running on the device.
- Object Detection: Evaluates the object detection functionality.
- Custom: Runs custom diagnostics depending on the specific deployment or model.
Each test shows a status result such as 'Passed' or 'Failed' along with the last run timestamp.
To run diagnostics:
- Click 'Run Diagnostics' under the desired module.
- The system will evaluate the relevant tasks.
- Results will appear with pass/fail status and progress percentage (e.g., 100%).
- You can click the eye icon to view additional details about each test result.
Devices - Version History
The Version History tab offers full transparency into the lifecycle of agent versions deployed to a specific edge device. This feature is especially valuable for audit tracking and troubleshooting.
Devices - Managing Alerts
Each device has a set of alerts (for example Device Down, Server Down, Camera Down, High Resource Usage) that notify you when the device reports a problem. You can enable or disable these alerts for one or more devices at once from the Devices table.
To manage alerts for one or more devices:
- Select one or more devices using the checkboxes in the leftmost column (see Bulk Actions above).
- In the floating toolbar, click Alerts to open the Manage Device Alerts dialog.
- Choose one of the two modes:
- Apply to all alerts: enable or disable every alert for the selected devices in one step.
- Customize per alert: toggle individual alerts. The list shows every alert type, with the most common ones (Device Down, Server Down, Camera Down, High Resource Usage) at the top. Each row shows the current status across your selection — enabled or disabled on all selected devices, or "Enabled on N of M devices" when it differs between them.
- Click Save. Only the alerts you changed are applied; a disabled alert stops producing notifications for the selected device(s) until you re-enable it.
When an alert's state differs across the selected devices, its checkbox is shown in a mixed (indeterminate) state; leaving it untouched keeps each device as it is and only changes the alerts you actually toggle.
You can also enable or disable all alerts for a single device from the switch on that device's overview page — the Manage Device Alerts dialog is the multi-device equivalent.
Resources - Sites
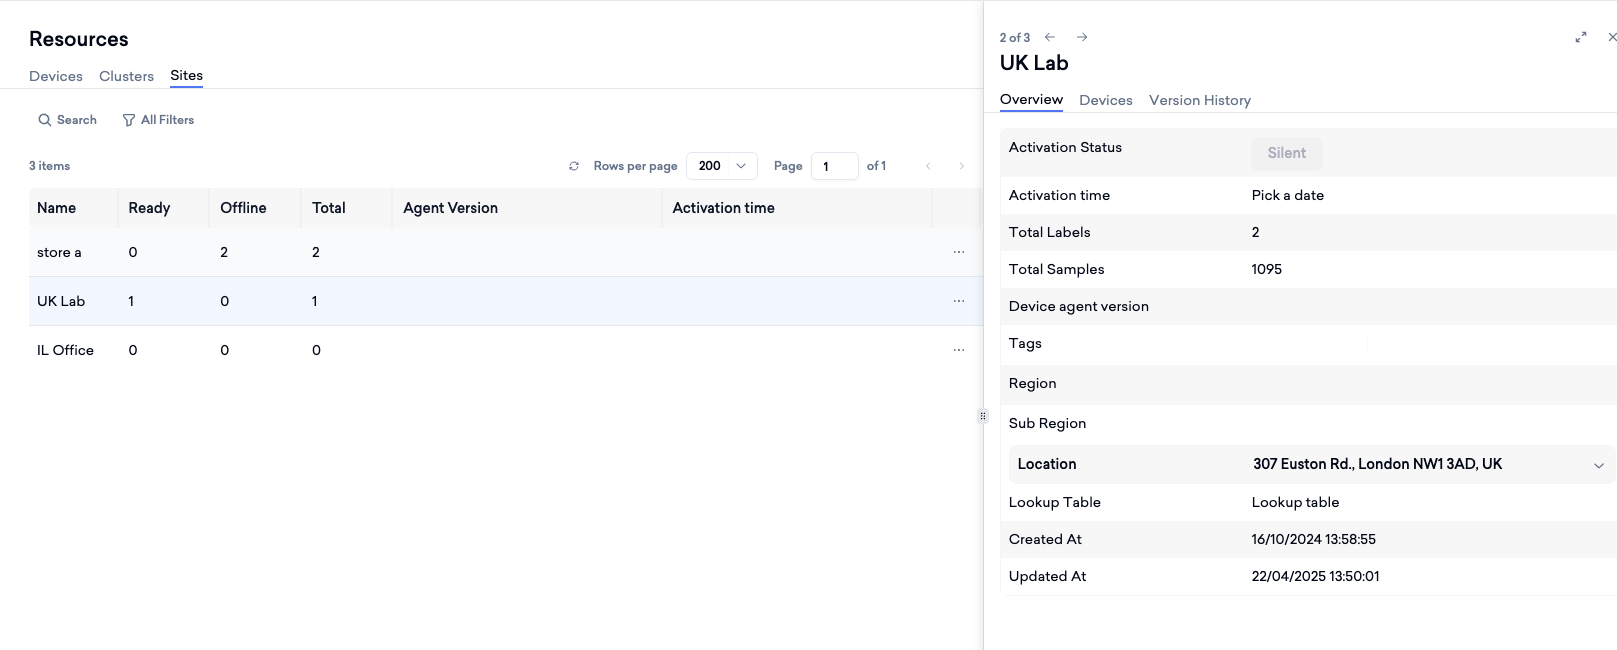
The Sites View within the Edgify Dashboard provides a comprehensive summary of all registered locations (stores) where your devices are deployed. This view offers an at-a-glance summary of operational readiness, device distribution and activation data. Clicking on a site row opens a detailed view showing comprehensive information. A site's detail view also lets you override the account's default Operational Hours for that specific site — see Account Settings > Operational Hours below for how the schedule works.
Filter by Site: Use the All Filters panel above the table to search for and select one or more specific sites by name — the table narrows to just the sites you've selected. This can be combined with the Tags filter at the same time to narrow further.
Download: Click the Download button above the table to export the current filtered list of sites as a CSV file — see Tables and Data Export above for details.
Update Site Group: Select multiple sites and use the Update Site Group bulk action in the floating toolbar to assign or move them all into a single Site Group at once — see Bulk Actions above for how multi-select works. Sites already in the target group are left unchanged; sites currently in a different group are moved into the new one.
Resources - Site Groups
Site Groups let you organize multiple sites together for shared configuration and bulk actions — for example, applying an Operational Hours schedule or catalog labels to every site in the group at once, rather than one at a time.
To create a site group, click Add Site Group from the Site Groups list and give it a name; sites can then be added to it from the group's own Sites tab.
Clicking a site group opens a detail view with three tabs:
- Overview: the group's name, its Operational Hours schedule (see Account Settings > Operational Hours below — a site group's schedule overrides the account default for every site in that group), and when the group was created.
- Sites: the sites currently in the group, with the same readiness/status columns as the main Sites view. Sites can be added to or removed from the group here.
- Labels: catalog label translations scoped to this group.
Filter by Site Group: Use the All Filters panel above the Site Groups list to search for and select one or more specific site groups by name, narrowing the table to just your selection.
Note: From the Site Groups list, selecting multiple groups exposes bulk actions, including applying an Operational Hours schedule to all selected groups at once. The same bulk-apply action is available from the Sites list for applying a schedule to multiple sites at once.
Resources - Clusters
- The Clusters View in the Edgify Dashboard offers a consolidated view of device groups organized by cluster, enabling efficient monitoring and management of device collections, collaborators and deployments.
- Clicking on a cluster, reveals more specific details in the right-side pane:
- Architecture: Displays the overall structure of the cluster’s deployment.
- Deployed Model: Shows the machine learning model(s) deployed in the cluster, including the version and deployment date.
- Model Deployed On: Date and time of when the deployed model was last updated.
- Total Labels: Total number of labels processed within the cluster.
- Total Samples: Total number of data samples collected within the cluster.
- Created At / Updated At: Timestamps indicating when the cluster was created and last updated.
- Download: Click the Download button above the table to export the current filtered list of clusters as a CSV file — see Tables and Data Export above for details.
Resources - Alerts
The Alerts view lists managed alerts triggered across your devices, grouped by event.
- Filter alerts by status, alert type, device, name, or a date range.
- Click an alert to view its details or update its status.
- Resolve: For an alert with status "Open", use the row's action menu (⋯) to resolve it.
- Bulk resolve: Select multiple alerts and use the Resolve bulk action in the floating toolbar to resolve them all at once — see Bulk Actions above for how multi-select and "select all from all pages" work.
- Download: Click the Download button above the table to export the current filtered list as a CSV file — see Tables and Data Export above for details. The exported file lists individual alerts rather than the grouped-by-event view shown on screen, so the number of rows in the download may not match the number of events displayed.
Resources - Catalog
The Catalog view lists the products configured for your account, including each item's price, family, and visibility.
- Filter the catalog by name, PLU, family, tags, or site.
- Upload a CSV file to bulk-create or update catalog items.
- Download: Click the Download button above the table to export the current filtered list as a CSV file — see Tables and Data Export above for details.
Data Review - Images
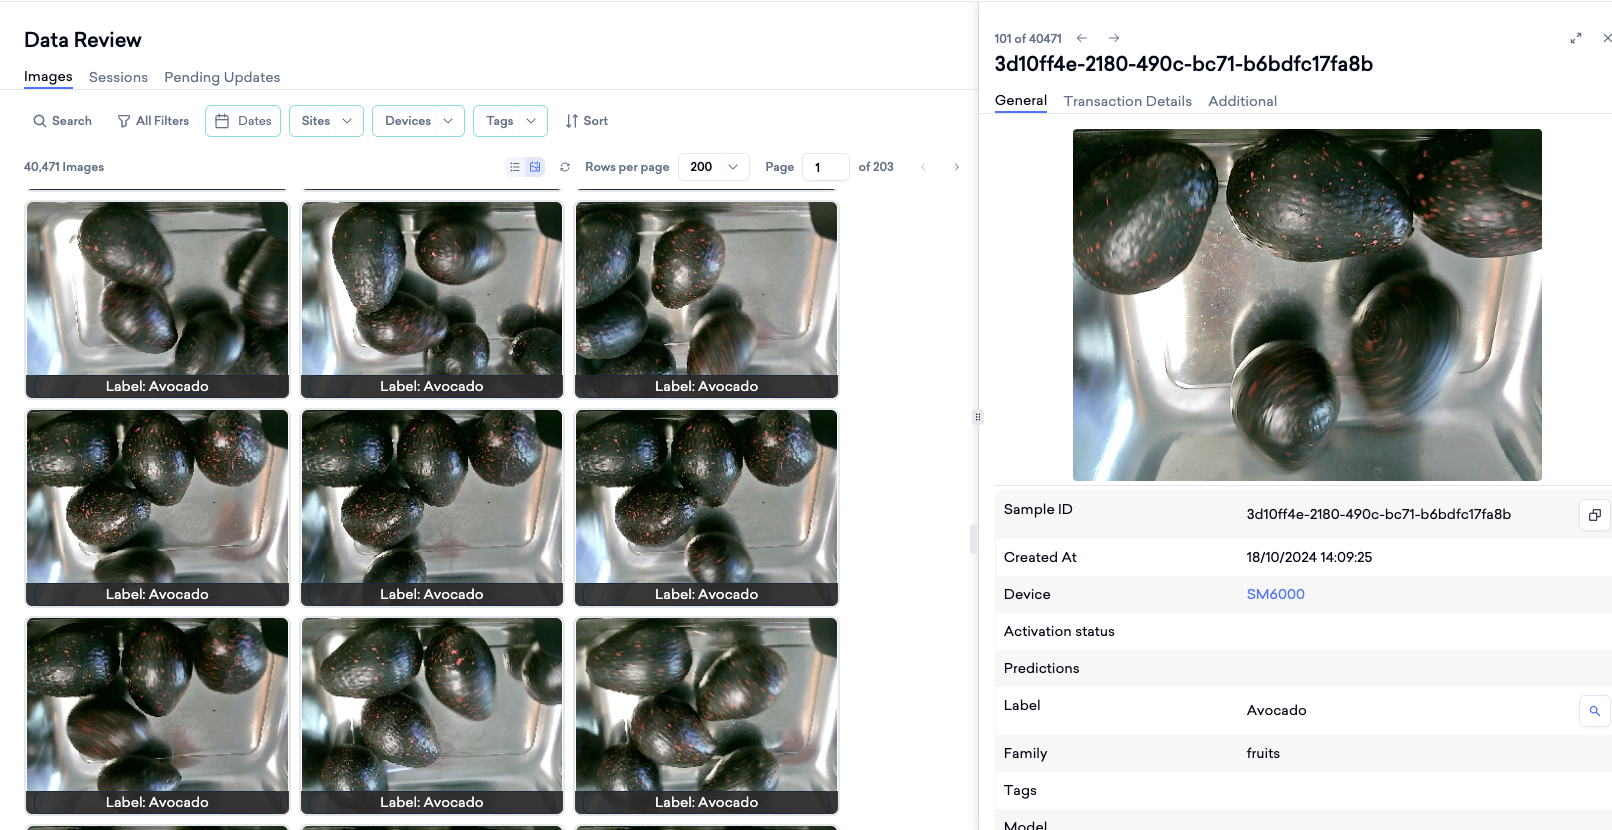
The Images displays all images from all devices by default used for data review. Each image includes metadata and identifiers to aid in image management and review. Images are arranged in a gallery view or a list view. Each image has identifiers and status indicators directly beneath the thumbnail and the label and prediction displays there.
Click the Filter button to open a range of filtering options, or use the elevated filters for quick access.
Image available: Enable this filter to show only samples that currently have a viewable image — whether the image is stored in the cloud or on a connected device. Samples with no available image are hidden, so you review only the data you can actually see rather than entries whose image is missing or not yet retrievable.
When you click an image thumbnail, you'll be taken to a detailed view:
The General Tab displays each sample shows its ID, capture details, device source, predictions, assigned labels and tags. It also includes the model used, match strength, and triggers applied.
The Transaction Details Tab displays individual item pricing, weight and quantity, along with the total price and barcode information. It also highlights any recorded loss or discrepancies for each transaction.
Reports
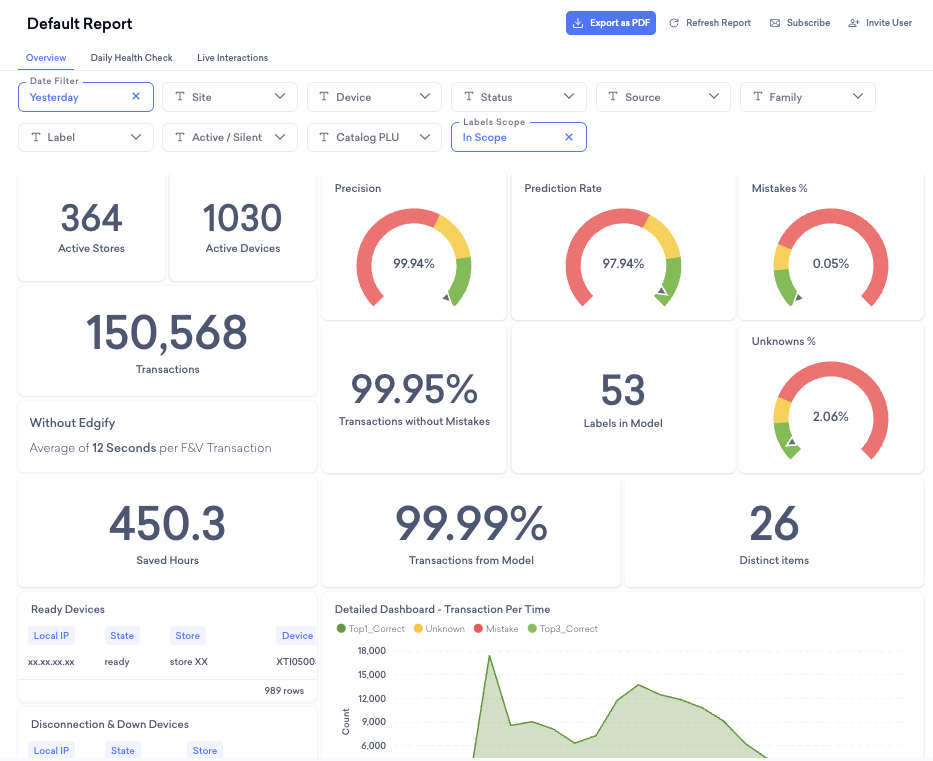
The Reports Section in the Edgify Dashboard provides a comprehensive view of performance metrics and system health. It includes:
Default - Report
Offers key statistics such as:
- Number of active stores and devices.
- Total transactions processed.
- Precision and prediction rates with visual gauges.
- Mistake percentage, unknowns, and total labels in the model.
- Transactions without mistakes and from model.
- Distinct items processed.
- Comparison of transaction processing times with and without Edgify.
- Saved hours metrics.
Insights and Trend Analysis: Additional tabs provide daily health checks, live interactions, and performance trends.
Key Actions
Export: Reports can be exported as PDFs.
Report Subscription: Users can create automated report subscriptions by specifying the subscription name, invitee list (email addresses to receive the reports) and scheduling preferences.
Report Sharing: Users can invite external users who do not already exist in the Edgify dashboard to view specific reports.
Analytics Hub
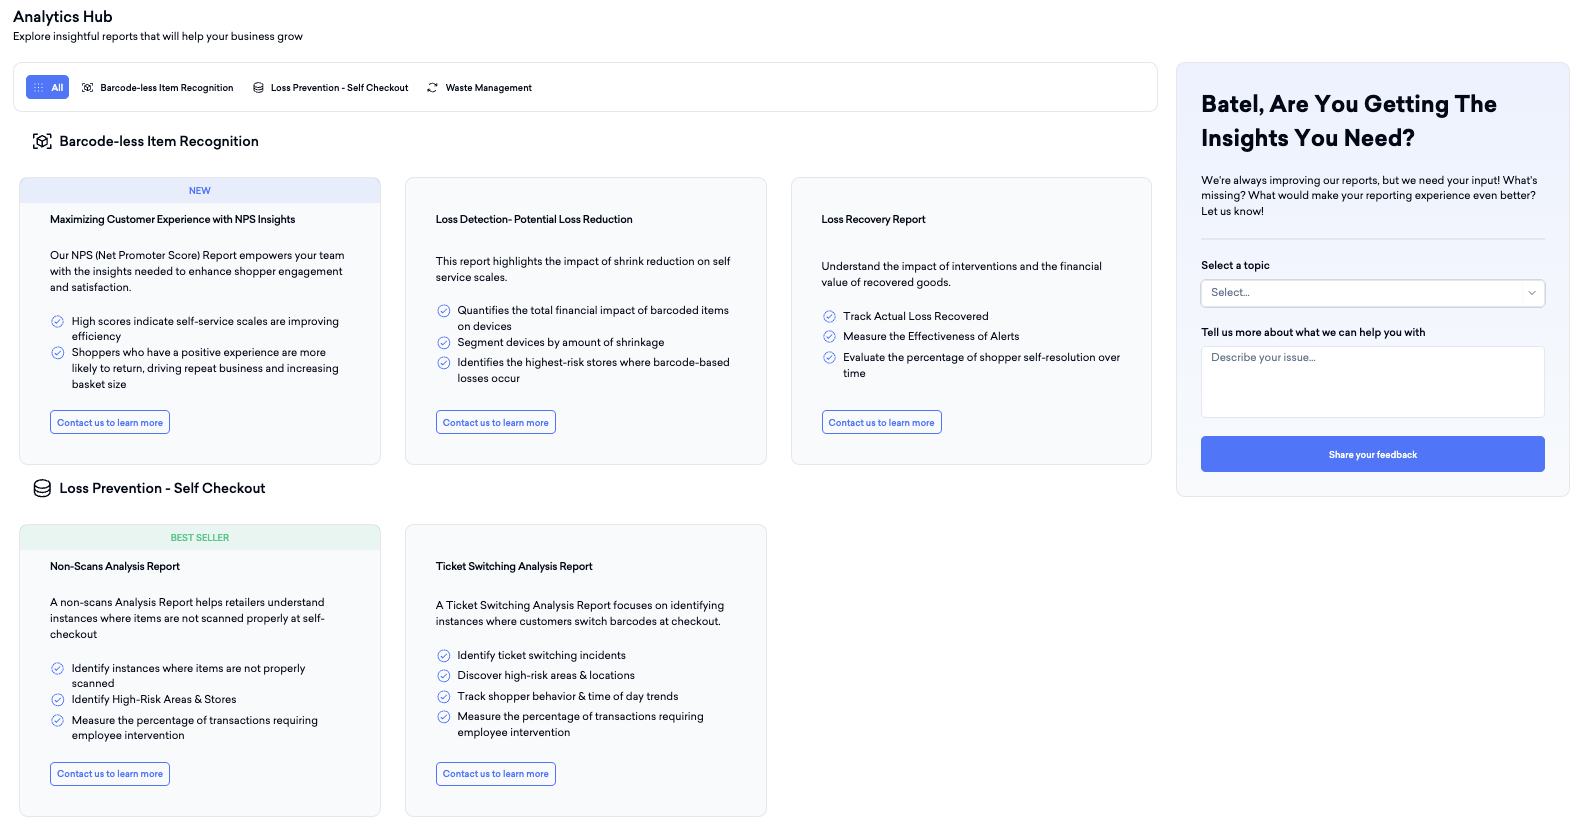
The Analytics Hub in Edgify provides a centralized location to explore a variety of solutions and insightful reports designed to optimize business operations. In addition, users can select specific report topics and provide feedback on their reporting experience and the metrics they would like to see, ensuring continuous improvement and customization.
Account Settings
Overview
The Settings section in the Edgify Dashboard provides essential configurations for your account. Here, you can view general account details such as the account name, logo, and token. You can also view configuration like the architecture, currency, and alert intervals for device and server downtime. These configurations help customize the system to your organizational requirements and maintain effective monitoring.
Non-scan daily capacity threshold
On the Account Settings → Overview page you can set the Non-scan daily capacity threshold — a whole number (default 600). It defines the maximum number of non-scan sessions selected for review and tagging each day.
This is the capacity input for Edgify's capacity-based tagging: rather than tagging a flat percentage of sessions, the system selects up to this many of each day's non-scan sessions for the tagging workflow. Increase it to send more sessions for tagging per day, or decrease it to send fewer.
At launch this setting is managed by Edgify — contact your account manager to adjust it.
Operational Hours
Operational Hours let you define a weekly schedule during which alerts are active, muting them outside those hours so your team isn't paged when no one is on shift. The schedule you set here is the account-wide default; individual sites and site groups can override it with their own schedule (see Resources > Sites and Resources > Site Groups above).
To configure the account-wide default:
- In Settings > Overview, click Edit.
- Toggle Enable Operational Hours on.
- Select the account's Timezone.
- For each day of the week, toggle it on or off and set a Start Time and End Time.
- Click Save.
Report settings
Edgify offers customized reports tailored to your specific metrics and business requirements, allowing you to gain valuable insights aligned with your operations. However, this feature is not included by default; the availability and scope of customized reports depend on the support plan subscribed to with Edgify. Please contact your Edgify account manager or customer success representative for further assistance and to discuss the options available for your account.
Users Management
Users with appropriate permissions can view and monitor a list of all users in the account. This list includes details like first name, last name, email, role, company, created by, last login, and status. The User Management section allows authorized users to manage access and permissions for other users in the account. Only users with the Owner role can create new user accounts. This includes setting the user’s email, role (such as Viewer, Tech, Owner) and additional details like name and company.
User Profile
Your user profile holds the details that belong to you rather than to the account — your name, your picture, and, if more than one account is available to you, which account the dashboard opens in when you log in.
To open it, click your avatar in the top-right corner and choose User Profile.
You can edit:
- First Name and Last Name — the name shown beside your avatar and in the Users Management list.
- Profile picture — click the avatar inside the dialog to pick an image.
- Default Account — only shown if more than one account is available to you; see below.
Click Save to apply your changes or Cancel to discard them. Save stays disabled until you change something.
Default Account
If more than one account is available to you, the Default Account drop-down sets which account the dashboard opens in the next time you log in. It is pre-selected to your current default and lists every account available to you — you can type in it to filter the list, which helps when it is long.
Changing your default account does not switch the account you are currently viewing. It applies at your next login. To change the account you are looking at right now, use the account selector in the top bar instead.
If only one account is available to you, this field is not shown — there is nothing to choose.